Editor's Note: You can use any graph from this article on your blog or website via a Creative Commons license – just provide a proper backlink and attribution.
ConstructoWiki Concrete Price Graph & Concrete Price Index
The construction industry has witnessed significant fluctuations in material costs over recent years, with concrete being a prime example.
From 2019 to 2024, the prices of concrete per cubic yard have shown a noticeable upward trend. This trend reflects various market dynamics, including supply chain disruptions, increased demand, and inflationary pressures.
As such, we’ve compiled data from the USGS, financial disclosures from some of the largest publicly traded concrete producers in the US, as well as multiple industry insights to arrive at a historical price of concrete.
In this post, we’ll explore these year-by-year changes in concrete prices from major suppliers. Understanding these shifts is crucial for industry professionals to make informed decisions and anticipate future cost developments.
Let’s jump in.
Table of Contents
Concrete Price Graph: 2019 to 2024

For more details and charts, visit our partners at ConcretePriceGraph.com
Changes in the Average Price of Concrete Over the Last 5 Years
Over the past five years, the average price of concrete has seen a notable upward trend. This increase can be attributed to various factors such as rising material costs, labor shortages, and increased demand for construction projects.
Price Trends from 2019 to 2024
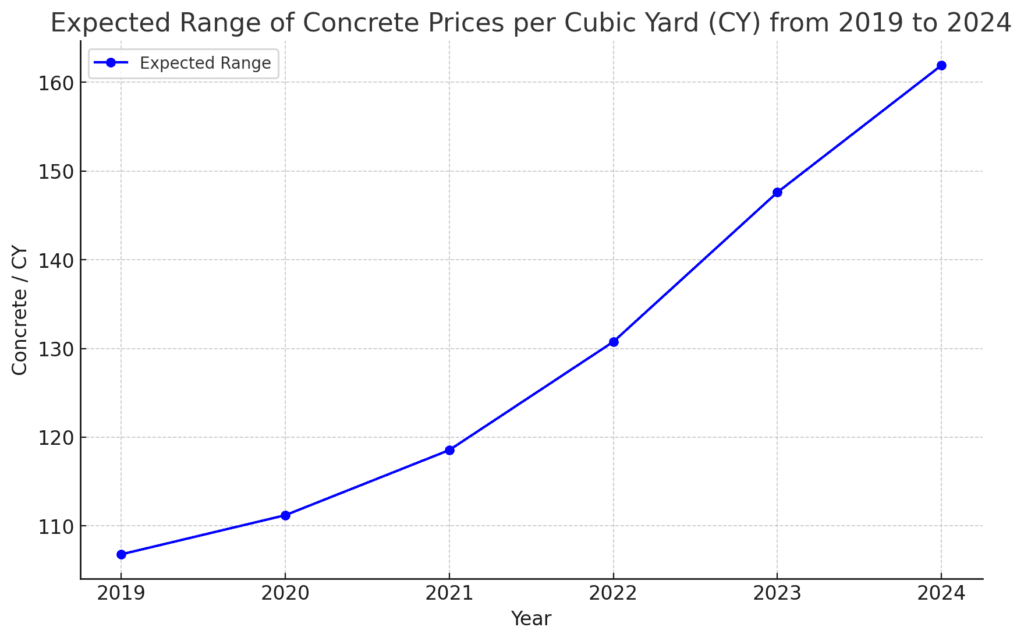
The expected range of concrete prices per cubic yard (CY) from 2019 to 2024 reveals a consistent increase each year. In 2019, the average price was approximately $106.80 per CY. By 2020, this figure had risen slightly to $111.21 per CY. This gradual increase continued into 2021, with prices reaching $118.55 per CY.
A more significant jump occurred between 2021 and 2022, where the average price increased to $130.76 per CY. This surge was likely influenced by the post-pandemic construction boom and supply chain disruptions that affected the availability of materials.
The trend continued upward in 2023, with the price per CY rising to $147.60. As we look to 2024, the expected range suggests an average price of $161.91 per CY. This steady increase highlights the ongoing pressures on the construction industry, from material costs to labor and regulatory changes.
Factors Influencing Price Increases
- Material Costs: The cost of raw materials such as cement, sand, and gravel has been on the rise. Supply chain issues and increased global demand have pushed prices higher, impacting the overall cost of concrete.
- Labor Shortages: The construction industry has been facing a significant labor shortage. Skilled labor is in high demand, and the scarcity has driven up wages, contributing to higher project costs and, consequently, higher concrete prices.
- Increased Demand: There has been a surge in construction activity, particularly in residential and commercial sectors. This increased demand has put pressure on supply chains and production capacities, leading to higher prices.
- Regulatory Changes: Environmental regulations and sustainability efforts have also played a role. The push for greener construction practices often involves additional costs, which are reflected in the price of concrete.
The data from 2019 to 2024 indicates a clear trend of rising concrete prices. As the industry continues to navigate challenges such as material costs, labor shortages, and increased demand, it is crucial for stakeholders to plan and budget accordingly.
Understanding these trends can help in making informed decisions for future projects, ensuring that costs are managed effectively while maintaining the quality and sustainability of construction activities.
MEthodology & Further Details On Concrete Price Changes Each Year

For more details and charts, visit our partners at ConcretePriceGraph.com
Methodology Behind The Concrete Price Graph
The ConstructoWiki Concrete Price Graph tracks the sale price of ready mix concrete from five of the largest publicly traded concrete producers in the US.
Using financial statements and disclosures, the data are updated regularly to reflect the evolving price of concrete.
This group’s weighted average pricing is probably higher than the overall US industry because these five firms possess the technical capabilities and strategically located plants necessary to handle large commercial and infrastructure projects. These projects typically demand higher strength mixes that use more expensive raw material blends.
Moreover, these firms only account for less than 10% of US concrete production, adding another limitation to the overall accuracy of the data. Still, it provides a solid proxy for monitoring and estimating US concrete prices.
Yearly Summary of Concrete Prices
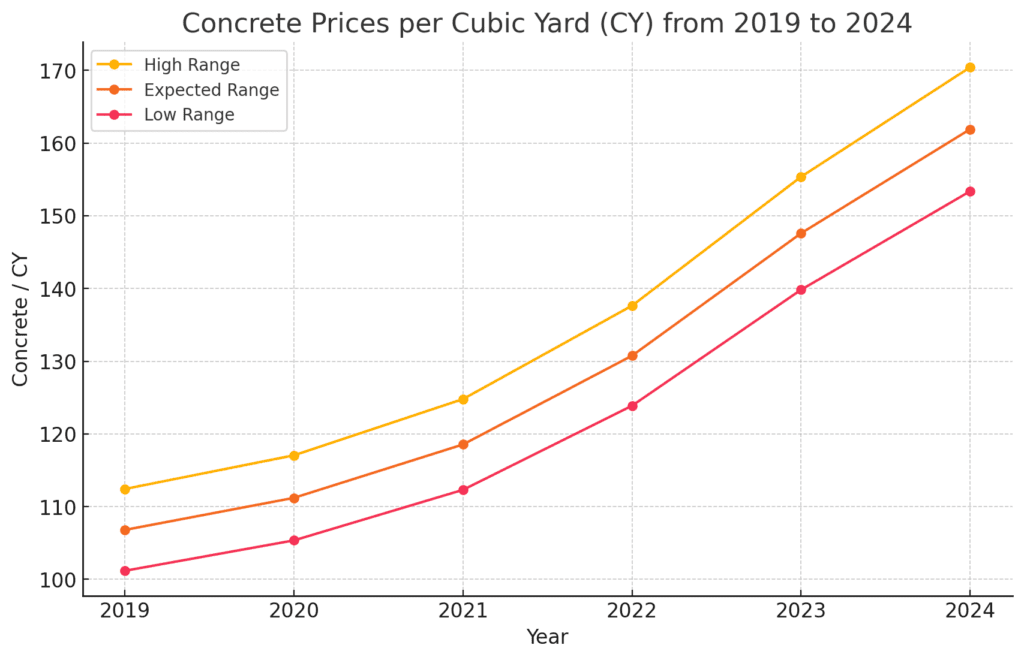
- 2019
- High Range: $112.43 per CY
- Expected Range: $106.80 per CY
- Low Range: $101.18 per CY
- Key Influences: Stable material costs, moderate construction activity, pre-pandemic market conditions.
- 2020
- High Range: $117.06 per CY
- Expected Range: $111.21 per CY
- Low Range: $105.36 per CY
- Key Influences: Slight increase in material costs, initial impacts of COVID-19, beginning of labor shortages.
- 2021
- High Range: $124.79 per CY
- Expected Range: $118.55 per CY
- Low Range: $112.31 per CY
- Key Influences: Continued material cost increases, significant demand for residential construction, ongoing labor shortages.
- 2022
- High Range: $137.64 per CY
- Expected Range: $130.76 per CY
- Low Range: $123.88 per CY
- Key Influences: Post-pandemic construction boom, severe supply chain disruptions, higher labor costs.
- 2023
- High Range: $155.37 per CY
- Expected Range: $147.60 per CY
- Low Range: $139.83 per CY
- Key Influences: Sustained high demand, continued supply chain issues, regulatory impacts for sustainable construction.
- 2024 (To Date)
- High Range: $170.43 per CY
- Expected Range: $161.91 per CY
- Low Range: $153.38 per CY
- Key Influences: Persistent high demand, ongoing labor and material cost pressures, adaptation to new regulations and sustainability practices.
Each year demonstrates a clear upward trend in the price of concrete, driven by a combination of increased material costs, labor shortages, heightened demand, and regulatory changes. This detailed breakdown highlights the cumulative impact of these factors on the construction industry’s economics.
Concrete Price Graph: Major Supplier Prices 2019 to 2024

For more details and charts, visit our partners at ConcretePriceGraph.com
Current Cost of Concrete: Per Cubic Yard and Per Square Foot
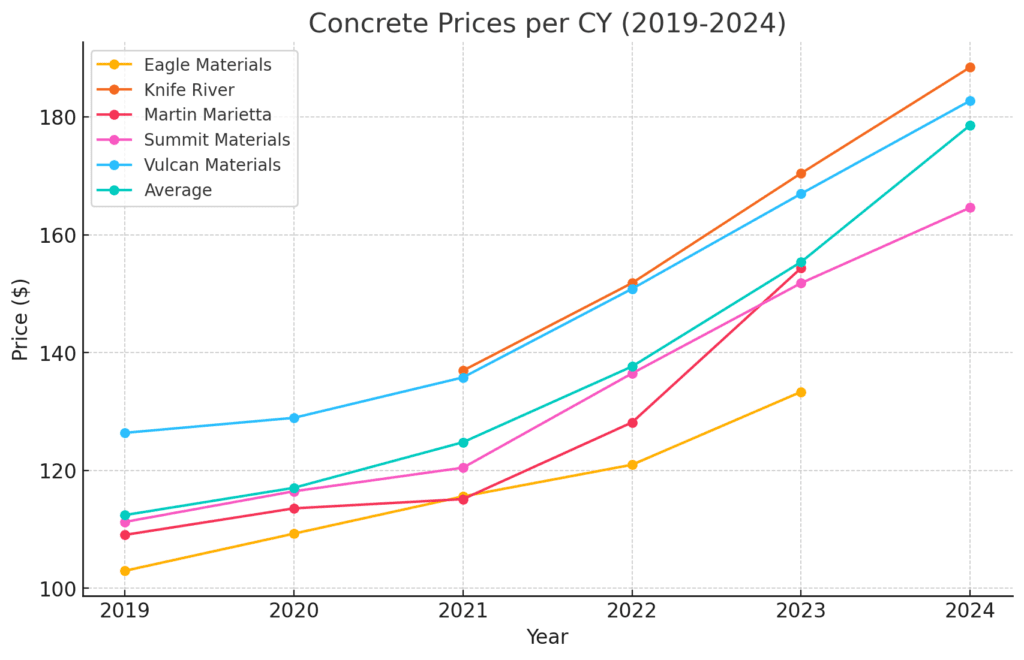
As of 2024, the average price of concrete per cubic yard (CY) has reached $178.58. This figure represents a significant increase from previous years, reflecting various economic factors and market trends that have influenced the cost of concrete. Understanding these costs is crucial for budgeting in construction projects, whether you’re planning a large-scale commercial build or a smaller residential project.
Average Cost Of Concrete Per Cubic Yard
The data from 2019 to 2024 shows a steady increase in the price of concrete. In 2024, the average cost per cubic yard is $178.58. This price is a culmination of rising raw material costs, supply chain disruptions, labor shortages, and increased demand in the construction industry.
Average Cost Of Concrete Per Square Foot
The average cost of a yard of concrete today is $178.58, and the cost per square foot, based on a standard 4-inch slab, is approximately $2.20. Keeping ahead of these costs and the factors driving them ensures better planning and resource allocation in construction projects.
Ready Mix Concrete Shipments Graph

For more details and charts, visit our partners at ConcretePriceGraph.com
Analyzing Ready Mix Concrete Shipments (2014-2023)
In the world of construction and infrastructure development, ready-mix concrete remains a cornerstone material, essential for various projects ranging from small residential homes to large-scale commercial buildings.
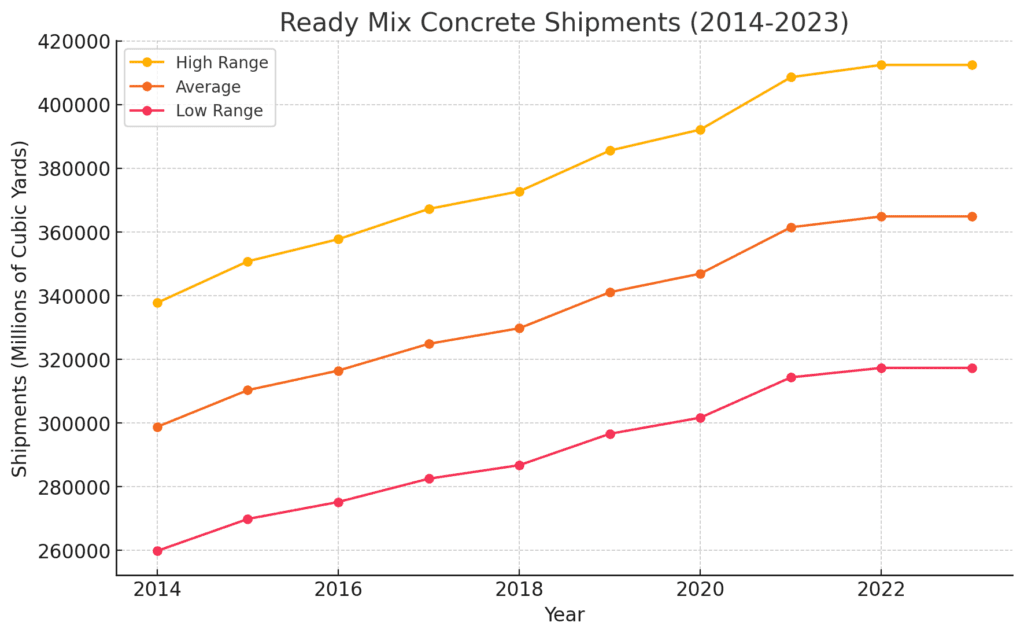
The chart above illustrates the annual shipments of ready-mix concrete, measured in millions of cubic yards, from 2014 to 2023. The data is segmented into three categories: High Range, Average, and Low Range shipments.
Key Observations:
- Steady Growth in Shipments:
- Across all ranges, there is a clear upward trend in the volume of ready-mix concrete shipments over the ten-year period. This steady growth highlights the increasing demand for construction materials, driven by ongoing urbanization and infrastructure development projects worldwide.
- High Range Shipments Lead the Way:
- The High Range shipments consistently show the highest figures, starting from 337,763 million cubic yards in 2014 and reaching 412,500 million cubic yards by 2023. This substantial growth underscores significant investments in large-scale projects that require vast amounts of concrete.
- Consistent Increase in Average and Low Range Shipments:
- The Average and Low Range shipments also exhibit a consistent increase. Average shipments rose from 298,790 million cubic yards in 2014 to 364,904 million cubic yards in 2023. Similarly, Low Range shipments climbed from 259,817 million cubic yards to 317,308 million cubic yards over the same period. This consistent rise across all ranges indicates broad-based growth in the construction sector, encompassing both large and small projects.
- Implications for the Construction Industry:
- The upward trend in ready-mix concrete shipments reflects a robust construction industry, buoyed by a mix of residential, commercial, and infrastructural developments. For industry stakeholders, including suppliers, contractors, and policymakers, this data serves as a critical indicator of market health and future opportunities.
Cement Content and Production Estimates:
The High Range and Low Range estimates provide insights into the variability of cement content in ready-mix concrete. The High Range estimates are based on the assumption that a lower ratio of cement (approximately 10%) is used in concrete mix. Conversely, the Low Range estimates assume a higher cement content (around 15%).
This variability in cement content significantly affects the total amount of concrete that can be produced. With a lower cement ratio, more concrete can be made from the same amount of cement, leading to higher shipment volumes in the High Range estimates. On the other hand, a higher cement ratio results in less concrete being produced per unit of cement, reflecting in the lower shipment volumes of the Low Range estimates.
Data Source and Industry Implications:
The information presented in the chart is derived from the USGS cement production and shipment statistics in the United States. These statistics serve as a useful proxy for concrete production since roughly 75% of all cement shipments in the US are directed towards ready-mix concrete producers. This close correlation allows for a reliable estimation of the ready-mix concrete market size and its growth trends.
By analyzing these statistics, industry stakeholders can gain a comprehensive understanding of the concrete market dynamics and make informed decisions. The consistent growth in ready-mix concrete shipments reflects a robust construction industry, buoyed by a mix of residential, commercial, and infrastructural developments. For suppliers, contractors, and policymakers, this data is crucial for strategic planning and resource allocation.
A Conclusion On The ConCrete Price Graph
In summary, the detailed analysis of concrete price trends from 2019 to 2024 reveals a complex interplay of factors driving up costs.
As we navigate through persistent supply chain disruptions, labor shortages, and regulatory pressures, understanding these trends becomes crucial for anyone involved in the construction industry. The ongoing rise in concrete prices underscores the need for strategic planning and adaptability in budgeting for future projects.
By staying informed of these trends, industry professionals can better manage the challenges of fluctuating costs while ensuring the sustainability and efficiency of their construction endeavors. This vigilance will be essential as the industry continues to evolve in response to economic, environmental, and social factors.
FAQ Section: Understanding Concrete Price Trends
1. Why have concrete prices increased from 2019 to 2024?
Concrete prices have risen due to a combination of factors including increased raw material costs, labor shortages, higher demand from construction sectors, and the impact of regulatory changes aimed at promoting sustainable practices. These factors collectively contribute to the upward trend in pricing.
2. What was the average price of concrete per cubic yard in 2019 compared to 2024?
In 2019, the average price of concrete was approximately $106.80 per cubic yard. By 2024, this price is expected to have increased to around $161.91 per cubic yard, reflecting significant price inflation over the five-year period.
3. How do supply chain disruptions affect concrete prices?
Supply chain disruptions can lead to delays in the delivery of raw materials such as cement, sand, and gravel, which are crucial for producing concrete. These delays often result in higher prices due to the limited availability of materials and increased transportation costs.
4. What impact do labor shortages have on the cost of concrete?
Labor shortages in the construction industry lead to higher labor costs as the demand for skilled workers exceeds supply. This increase in wages is passed on to the buyers through increased costs for services and materials, including concrete.
5. How do environmental regulations influence concrete prices?
Environmental regulations often require the use of more sustainable, but potentially more expensive, materials and practices. These regulations can increase the overall cost of concrete production, which in turn raises the market price of concrete.
6. What can industry professionals do to mitigate the impact of rising concrete prices?
Professionals can mitigate the impact by planning projects well in advance, budgeting for potential price increases, sourcing materials from multiple suppliers to ensure competitive pricing, and investing in technology and practices that improve efficiency and reduce waste.


